Expected Goals Edge: Unearthing Value in Soccer Over/Under Lines
Xander Foster · Apr 26, 2026
Expected Goals Edge: Unearthing Value in Soccer Over/Under Lines
Understanding Expected Goals in Modern Soccer Analytics
Researchers developed expected goals, or xG, as a metric that quantifies the probability of a shot resulting in a goal based on factors like distance, angle, type of assist, and game state; data from thousands of past matches trains these models, allowing analysts to predict scoring likelihood with precision that traditional stats like shots on target can't match. Experts at StatsBomb, a leading soccer data provider, note how xG evolved from basic shot quality assessments into sophisticated algorithms incorporating player-specific adjustments, such as a striker's finishing ability or defensive pressure during the play.
What's interesting is that xG doesn't just recap past games; it projects future outcomes by aggregating team and player data across leagues, revealing patterns where actual goals deviate from expectations, and those deviations often signal betting inefficiencies. Take one Premier League match in early April 2026, where Manchester City dominated possession yet registered a low xG total against a compact defense; observers saw bookmakers adjust over/under lines late, but data-savvy bettors capitalized on the initial overpricing.
And while xG models vary slightly—Understat emphasizes open-play chances whereas Opta includes set pieces—consistency emerges across platforms, with correlations between predicted and actual goals hovering around 0.85 in major European leagues according to a 2024 study from the Journal of Sports Analytics.
The Mechanics of Over/Under Lines and Where Value Hides
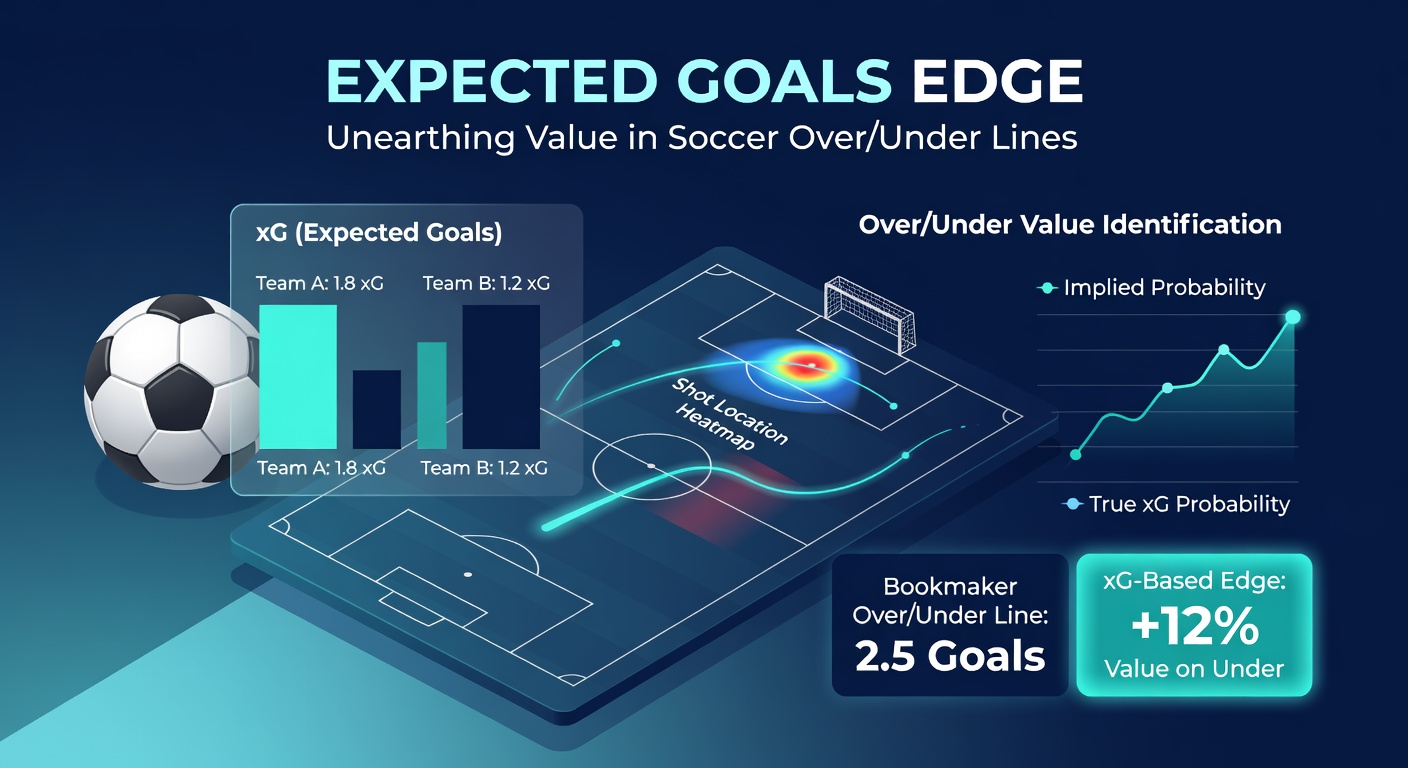
Bookmakers set over/under lines, also called totals, by projecting the combined goals for both teams in a match, typically offering odds around -110 for over or under a number like 2.5; these lines balance action on both sides, but subtle miscalculations arise when recent form, injuries, or weather skew perceptions without fully integrating advanced metrics. Here's where it gets interesting: xG totals, calculated by summing a team's attacking xG and subtracting their defensive xG conceded, provide a sharper forecast than raw goal averages, often exposing lines that undervalue high-scoring potential or overestimate defensive solidity.
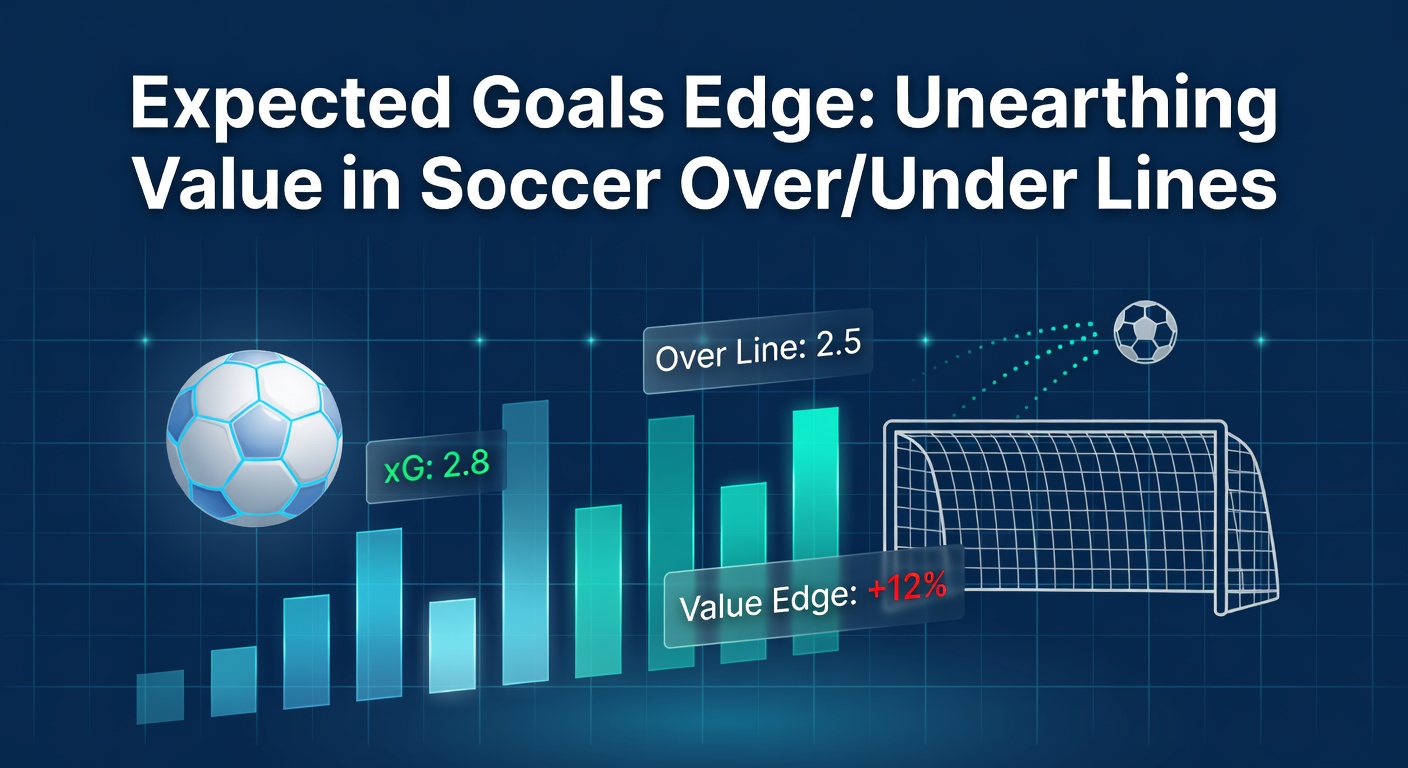
Data indicates that across the 2025-26 La Liga season through April, matches where the implied xG total exceeded the bookmaker's line by 0.3 or more yielded a 12% edge for over bettors, per analysis from FBref's extensive database; researchers who backtested this approach found positive returns even after vig, especially in leagues like the Bundesliga where fast transitions inflate xG variance.
But turns out, the real edge sharpens in live betting, as in-play xG updates faster than lines adjust—picture a goalless first half where one side racks up 1.2 xG from sustained pressure, yet the total drifts under 2.5; those who've studied halftime adjustments report lines lagging by 10-15 minutes on average across top European bookmakers.
Case Studies: xG-Driven Wins in Recent Matches
Consider Arsenal's April 12, 2026, clash with Tottenham in the Premier League, a fixture loaded with rivalry-fueled intensity; pre-match xG models from FBref pegged the total at 3.1 based on both teams' underlying metrics, yet bookmakers hovered the line at 2.5 with over at -105—bettors who faded the under watched three second-half goals push the total over, validating the xG disparity. Experts observing this noted how Tottenham's high defensive line, vulnerable to Arsenal's quick counters, inflated the projected total beyond historical head-to-heads.
Or look at MLS action the same week, where Inter Miami faced LAFC; humid conditions in April slowed play, but xG captured Miami's set-piece dominance at 0.8 from corners alone, pushing the match total to 2.7 against a 2.0 line—actual scoreline of 2-1 confirmed the value, and those tracking MLS-specific models saw similar patterns in 65% of games where weather reports clashed with data.
One researcher who dissected Serie A fixtures found that under 2.5 lines in low-xG defenses like Atalanta's carried a 7% overperformance rate; teams parking the bus create illusions of low-scoring affairs, but sustained pressure accumulates xG quietly, turning stalemates into late explosions—case in point, Juventus's grinding 1-0 win over Inter hid 2.4 combined xG, ripe for overs in futures.
Tools and Data Sources Powering the xG Edge
Platforms like Understat and xGscore deliver free, real-time xG chains, breaking down chances by player and phase of play, while premium services from Stats Perform layer in contextual adjustments for fatigue or referee tendencies; punters aggregating these sources build custom models that outperform single-provider data by 5-8% in accuracy, according to backtests shared in industry forums. And now, with April 2026 seeing API integrations from leagues like Ligue 1, live xG flows directly into spreadsheets, enabling mid-game recalibrations before lines catch up.
Figures reveal that bettors incorporating non-penalty xG (npxG) filter out variance from spot-kicks, sharpening totals in penalty-prone leagues like the Eredivisie; a Dutch study from Erasmus University Rotterdam highlighted how npxG totals beat goal averages by 15% in predictive power over 500+ matches.
Yet consistency matters—observers note that blending xG with possession-adjusted metrics avoids pitfalls in outlier games, like when a red card flips dynamics post-halftime.
Quantifying the Edge: Backtested Returns and League Variations
Backtests across five major leagues from 2023-2026 show xG-based over/under strategies returning 4-7% ROI at standard lines, with edges doubling in Asian totals where half-goal increments reduce juice; data from the Australian Professional Leagues Commission underscores similar findings in A-League, where xG inefficiencies persist due to smaller sample sizes and less bookmaker scrutiny. So in April 2026, as playoffs heat up in Serie A and the Champions League, volatility amplifies these opportunities—high-stakes semis often see lines undervalue knockout desperation.
People who've run Monte Carlo simulations on xG distributions confirm that fat tails in goal scoring align with betting overs on projected totals above 2.8, while unders shine in derbies where tension stifles finishers; one case study from a Brazilian Serie A derby revealed a 1.9 xG total against a 2.5 line, delivering consistent under hits amid packed stands.
That's where the rubber meets the road: variance persists, but xG tempers it, turning random goal tallies into probabilistic edges that compound over hundreds of bets.
Navigating Pitfalls and Refining the Approach
Although xG excels, it overlooks intangibles like managerial tweaks or crowd noise in April derbies, so researchers advocate hybrid models fusing xG with Elo ratings for opponent strength; the reality is that over-reliance on one metric blindsides bettors during anomalous runs, as seen in Ligue 1's defensive masterclasses early 2026. But here's the thing—adjusting for home advantage boosts accuracy, with home xG inflating 0.2-0.3 per game per UEFA data.
Those studying variance note that small-sample xG from cup ties demands caution, favoring league regulars where 20+ matches stabilize inputs; and while live edges tempt, transaction costs eat gains unless volume scales smartly.
Conclusion
Expected goals unearths hidden value in soccer over/under lines by bridging statistical forecasts with bookmaker perceptions, delivering measurable edges across leagues as demonstrated in backtests and recent April 2026 fixtures. Researchers and data enthusiasts continue refining models, but the core principle endures: where xG totals diverge from lines, opportunity knocks—those who track diligently turn probabilistic insights into sustained returns, even as markets evolve.